Panels and Calls
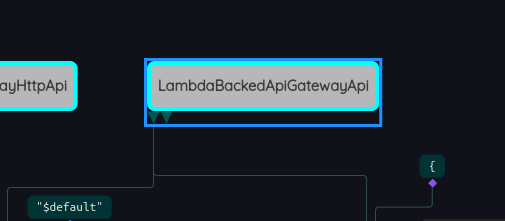
If the Polly tab is not selected in the panel browser (in the Panels tab at left), then select it. This example has 9 panels. The panel named perform occurs twice in the project because it is called from two other panels. Each panel appears nested beneath a panel that calls it. The panel display is therefore indented according to the calling relationship among the panels. The Polly panel for example calls ApiGatewayHttpApi, LambdaBackedApiGatewayApi, and LambdaAddEventSourceHttpApi. The three calls can be seen quite clearly in the screenshot above; they are gray with cyan outline, and each contains the name of the panel it calls.
You can navigate among the panels by clicking on panel names in the panel browser at the left. You can also navigate from a call node (like the three in the Polly panel) to the circuit that is called, by double-clicking on the call node. Try double clicking on the call to LambdaBackedApiGatewayApi:

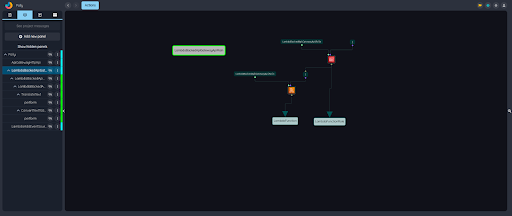
The editor will navigate to the panel named LambdaBackedApiGatewayApi, and the editor should look something like this:

The panel being displayed is highlighted in the panel browser at left, and its contents are displayed on the canvas that occupies the main central area of the editor.
Once again we see a call node, this time to LambdaBackedApiGatewayApiMain, but this call is outlined in green rather than cyan. At this point you may have noticed that the color of a call node’s outline matches the color of the bar to the right of its name in the panel browser. LambdaBackedApiGatewayApiMain for example has a green bar to the right of its name:

and the call to it has a green outline:
